
Air Freight Disruptions
{meta.headline}
Logistics organizations using CargoWise impacted
Aggregated CargoWise data indicates

{round(summary.organizationsImpacted)}
Logistics organizations using CargoWise impacted

{round(summary.shipmentsDisrupted)}
Shipments disrupted

{summary.organizationsImpactedPercentage}
of Logistics organizations using CargoWise disrupted
{summary.shipmentsDisruptedPercentage}
Shipment disruption rate
Where the disruption hits
 High impact
 Medium impact
Bubble size = number of disrupted shipments in that city. Large bubble = more shipments hit. Click any bubble for details.
What {meta.headline} looks like
Each box is a logistics organization. Blue = impacted. {round(summary.organizationsImpacted)} logistics organizations using CargoWise had shipments disrupted.
CargoWise solutions to keep you updated
Solution
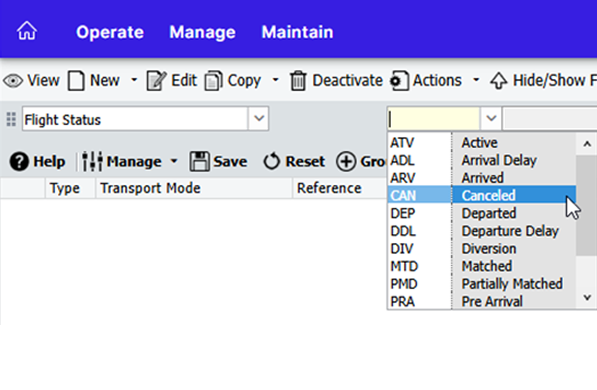
Flight status visibility
Surface cancellation details directly within impacted air consols, helping your teams identify exposure quickly and take corrective action.
Solution
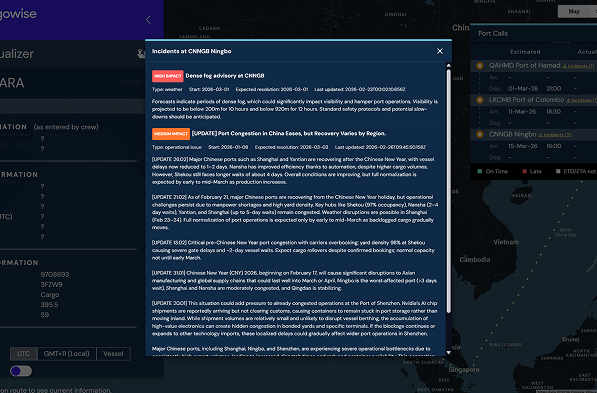
Route Visualizer
Align emerging risk to active ocean shipments, helping you evaluate exposure and prepare for rotation changes, congestion, or downstream delay.
Solutions
Built for every mode. Ready for every move.
The single platform that powers global logistics from origin to destination.
Disclaimer:
The figures and insights presented in this infographic are based on aggregated and anonymised data derived from CargoWise platform activity. All statistics are indicative only and represent approximate trends observed at a point in time. These numbers do not reflect the operations, volumes or exposure of any individual customer, shipment or organisation. Actual impacts may vary by customer, trade lane, carrier, and operational circumstances